Linking passenger sentiment
with queue analytics.
Video analytics on existing CCTV combined with QR-code passenger feedback — driver analytics revealing which operational factors most influence NPS and satisfaction across immigration and security.
Feedback without context. Drivers of dissatisfaction hidden.
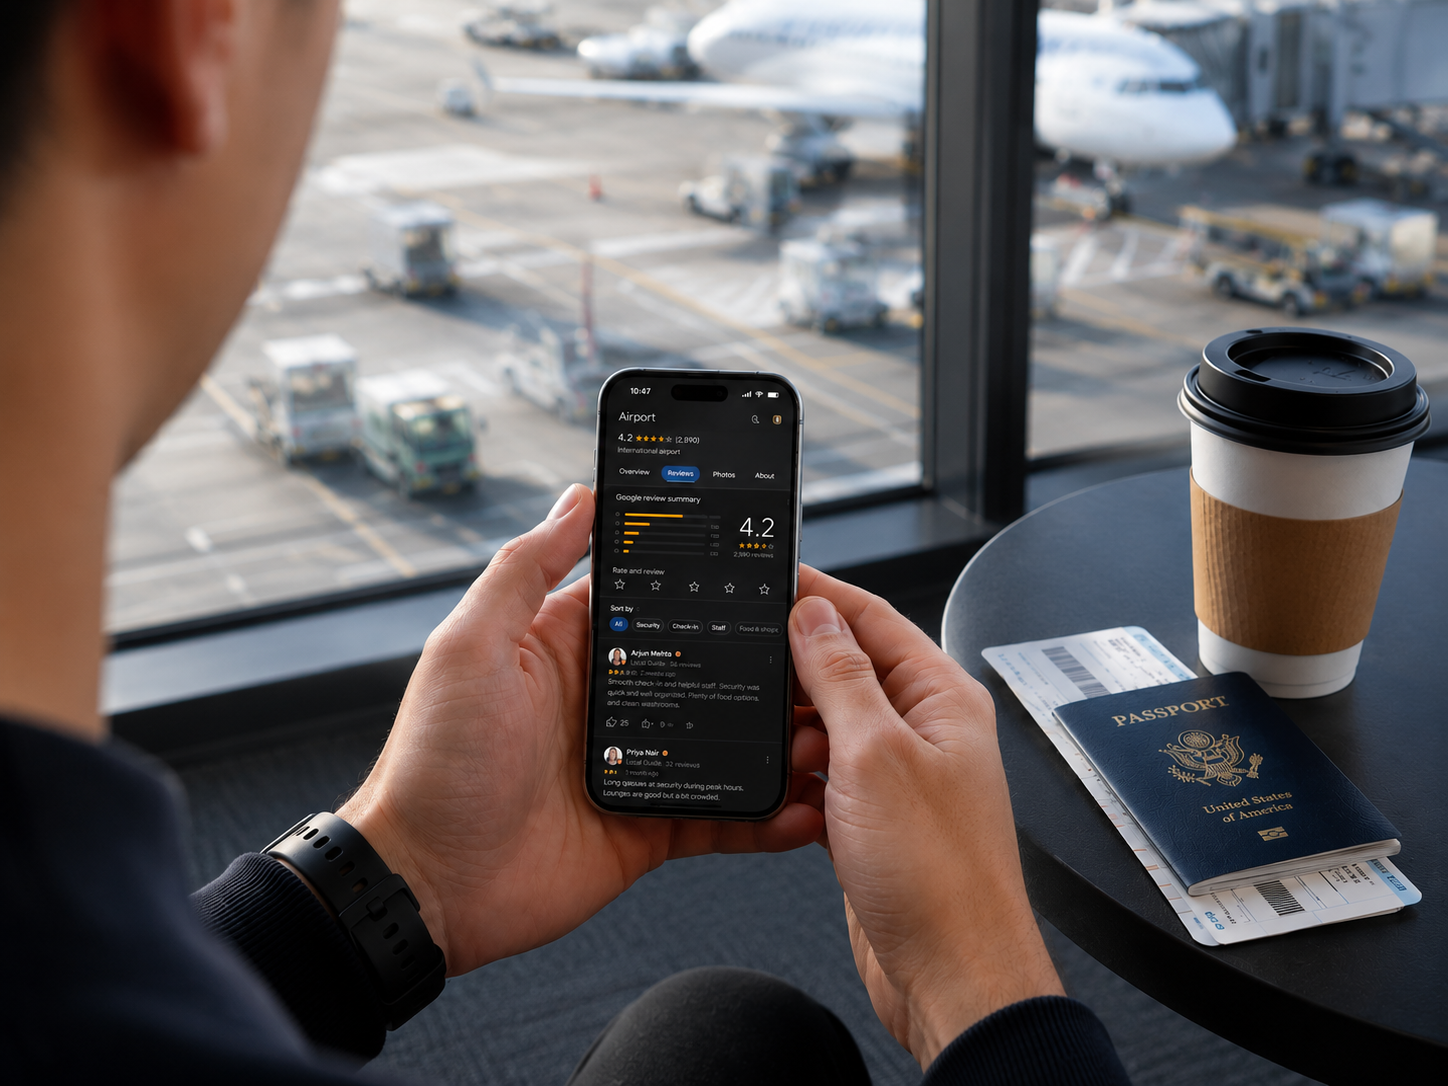
An airport wanted to better understand the factors influencing passenger satisfaction — particularly within high-traffic processing areas such as immigration and security. Passengers were providing feedback through QR codes, but the airport lacked the operational context to understand why passengers were reporting positive or negative experiences. Without linking customer feedback to real-time conditions like queue lengths, wait times, and passenger volumes, the root causes of dissatisfaction stayed hidden.
Sentiment + operations, on one dataset.
BI3 implemented a video analytics solution on the airport's existing CCTV — measuring queue lengths, passenger volumes, and estimated wait times — and integrated those operational metrics with passenger feedback collected via QR codes. The combined dataset powered driver analytics to identify the operational factors most strongly influencing NPS, plus what-if scenario modelling.
Video analytics on CCTV
Computer vision models measured queue lengths, passenger volumes, and estimated wait times across key processing areas.
QR-code feedback integration
Passenger sentiment captured at point-of-experience via QR codes, integrated with the operational dataset.
Driver analytics
Identified the key operational factors most strongly influencing passenger satisfaction and NPS.
What-if scenario modelling
Integrated dataset enabled scenario modelling for staffing and infrastructure investment decisions.
One dataset. Two perspectives. Real drivers.
Eye4.ai's computer vision combined with QR-code sentiment data — joined into a single analytics dataset so operational decisions are made against what passengers actually feel.
Anecdotal feedback, replaced.
Investment, prioritised by impact.
Drivers identified
Exactly how queue lengths and wait times impact NPS scores.
Unified dataset
Operational metrics joined with sentiment data — replacing anecdotal feedback.
Prioritised improvements
Leadership focused on the changes delivering the greatest passenger benefit.
Investment optimised
Staffing and infrastructure investment modelled with real driver data.